We hold ourselves accountable to the sector we serve, the customers who use it and to each other through integrity of governance, clarity of process and independence of decision making. As part of being accountable, we are therefore reporting on adjudicative performance through this dashboard.
Our Adjudicative Reporting Dashboard provides regulated entities with more transparency into our adjudicative process, in particular the metrics and targets we have set to measure the efficiency of our decision-making. First published in 2021, the dashboard is updated twice per year.
What follows is a summary of achievements against our adjudicative targets for Q1 and Q2 of Fiscal 2025-2026.
Current Report
Fiscal 2025-2026: Year-End Results (April 1, 2025, to March 31, 2026)
- The OEB issued 272 decisions in Fiscal Year 2025-2026 – 85% of panel decisions and 98% of Delegated Authority decisions were issued in accordance with the Total Cycle Time performance standards of 85% and 95%, respectively.
- Of all decisions issued, 75% were issued more than 14 days in advance of the metric date.
- December 2025 was the month in which most decisions were issued by the OEB. Fifty-one decisions were issued this month, or 19% of all decisions.
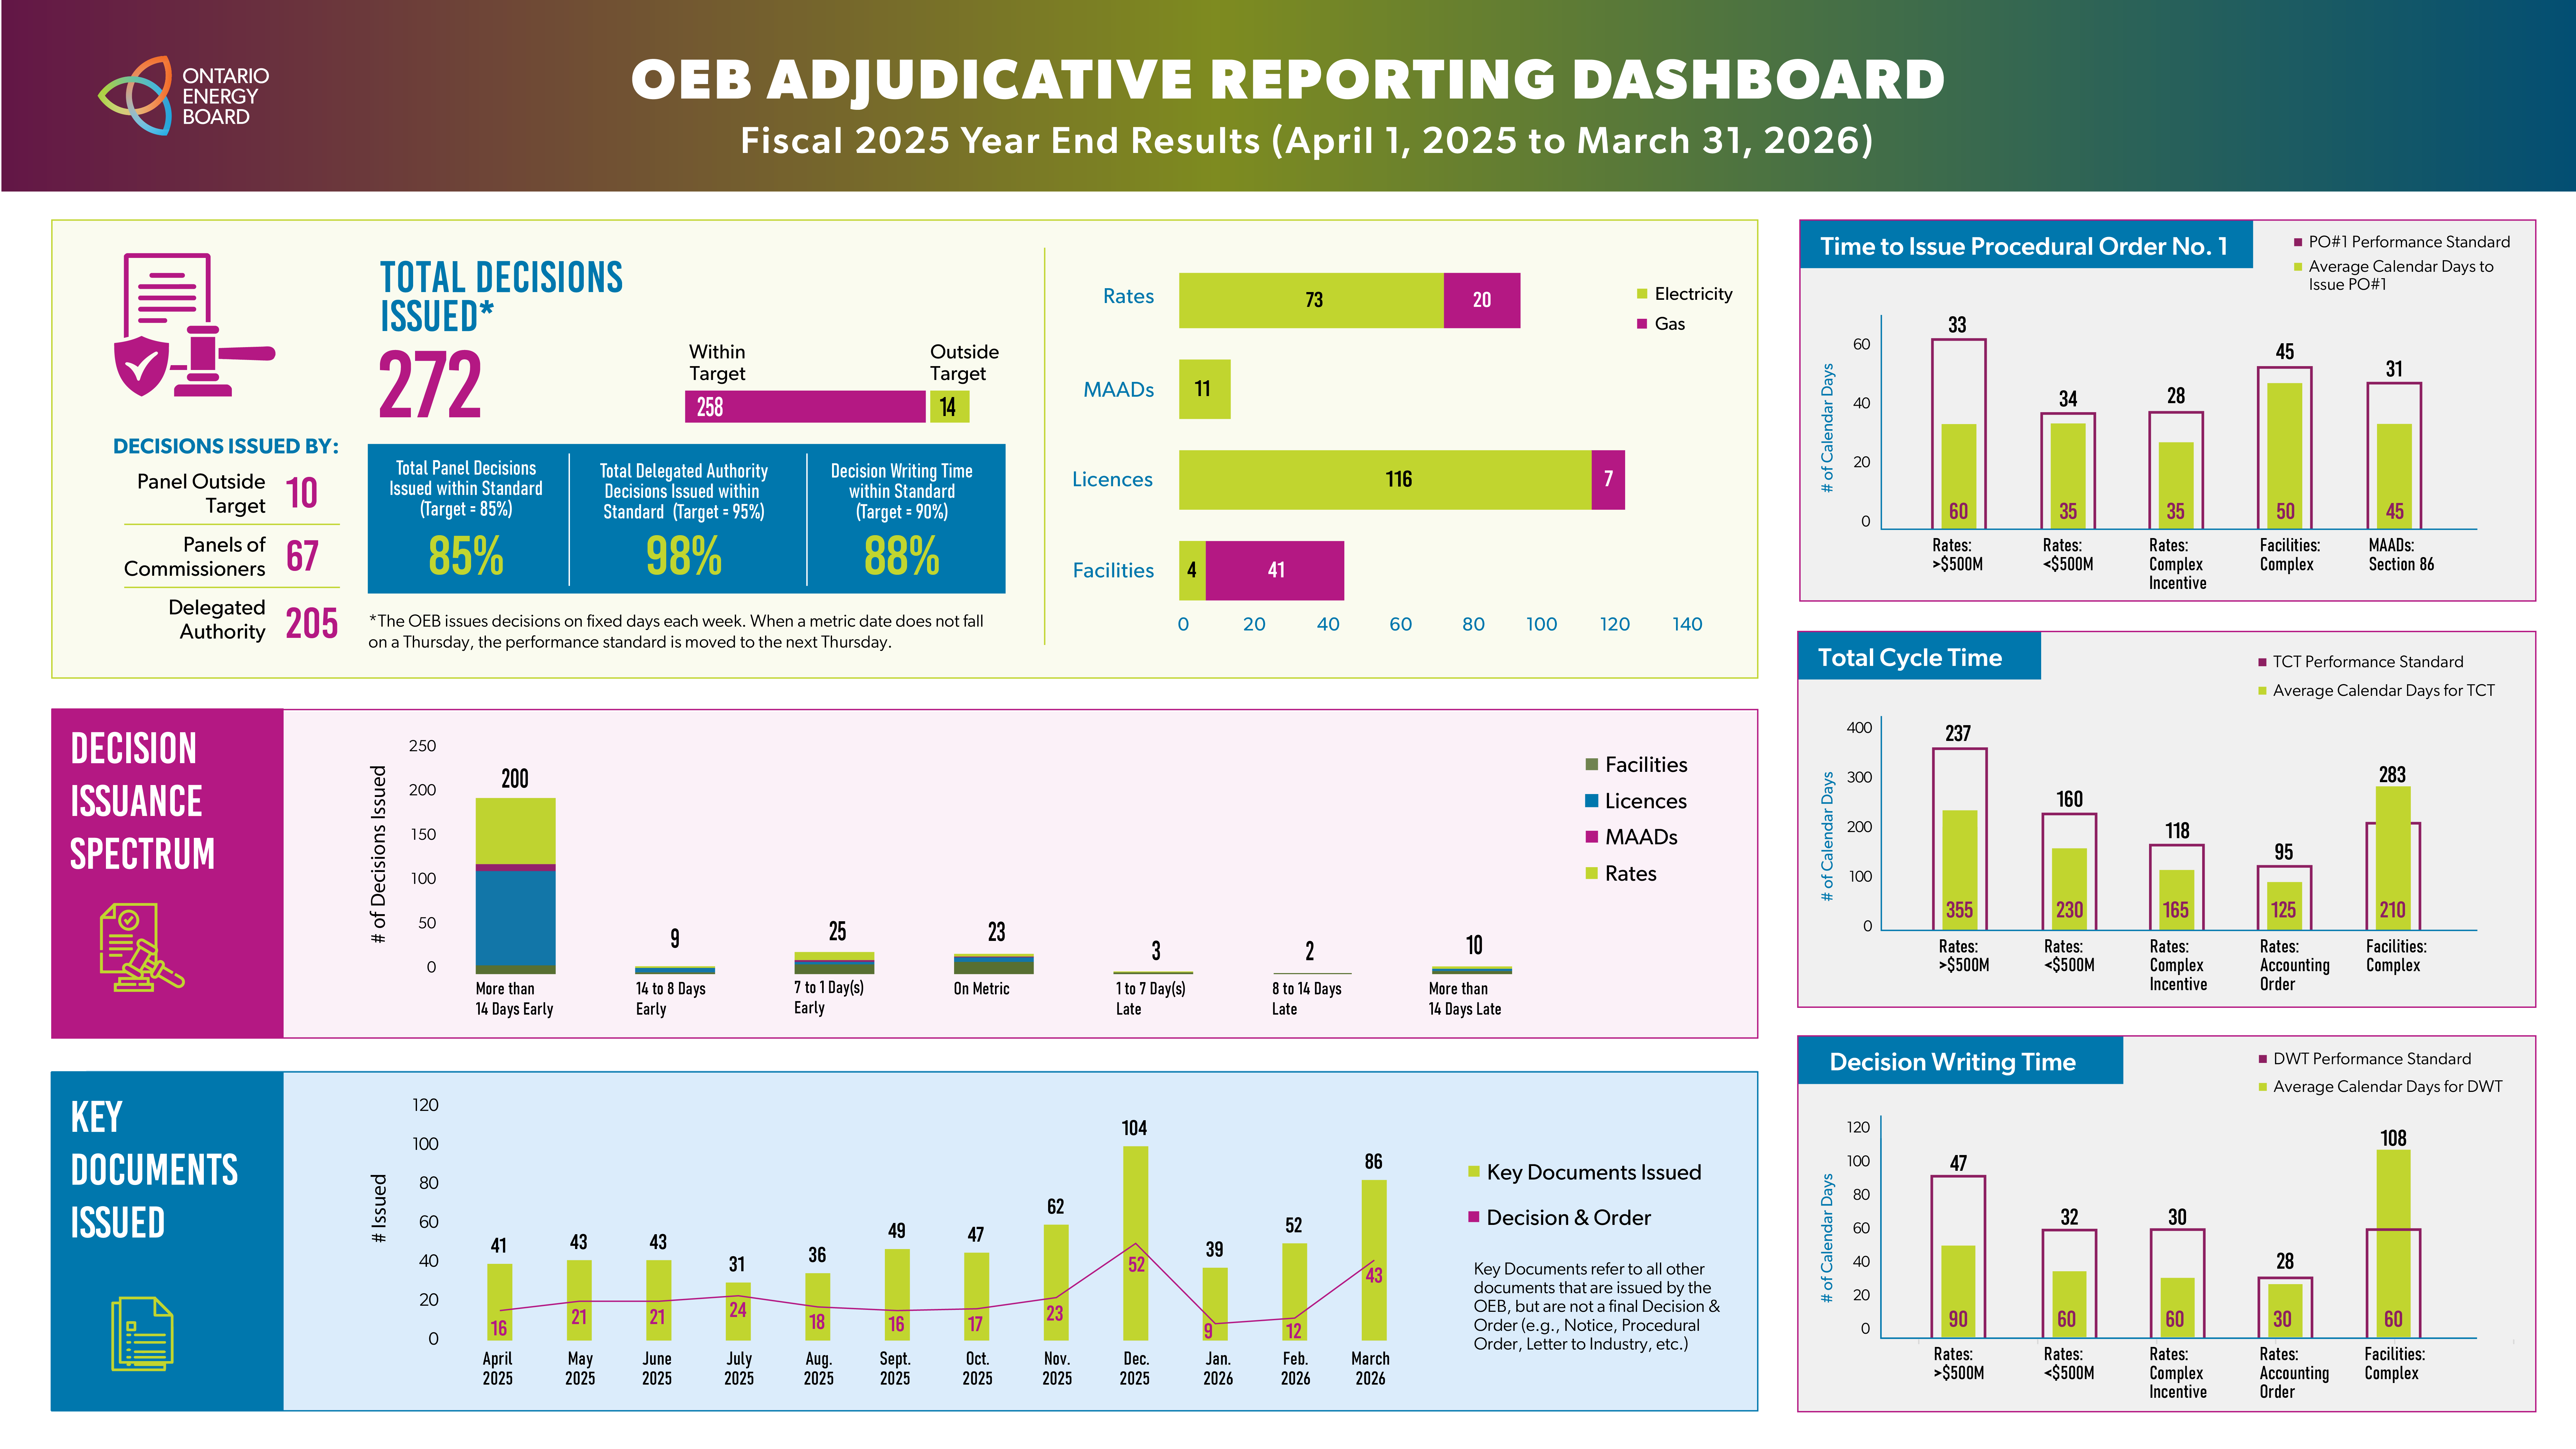
Total Decisions Issued
The majority of decisions (75%) issued by the OEB were heard by Delegated Authority. This is consistent with historical trends.
75% of the decisions issued in Fiscal Year 2025-2026 were for applications related to electricity. This is consistent with historical trends.
45% of all the decisions issued were for Licence applications. Rates comprised 34% of decisions, followed by Facilities (17%) and Mergers, Amalgamations, Acquisitions and Divestitures (4%).
Decision Issuance Spectrum
In addition to monitoring whether a decision is issued on time or late, the OEB also monitors the degree to which decisions were issued early or late relative to the Total Cycle Time decision metric date established by the applicable performance standard. This Decision Issuance Spectrum highlights the fact that 74% of decisions issued this reporting period were issued more than two weeks in advance of the total cycle time metric date. This is consistent with historical trends.
Key Documents
The OEB issues many documents aside from decisions each month. Key Documents refers to all other documents that are issued by the OEB but are not a final Decision and Order (e.g., Notice, Procedural Order, Letter to Industry, etc.). On average, the OEB issued 48 Key Documents each month of Fiscal Year 2025-2026. This is 14% higher than the five-year average of 42.
Average Time for Procedural Order No. 1 (PO#1), Decision Writing and Total Cycle
The OEB has committed to report on the performance of key application milestones for applications heard by panels of Commissioners for major application types. The following three graphs below illustrate the performance for various application types relative to the performance standard for:
This graph provides the average time from receipt of a complete application to the issuance of Procedural Order No. 1 and compares this to the performance standard.
This graph provides the average time from the close of the record to the issuance of the decision and compares this to the performance standard.
The average Decision Writing Time for the Facilities: Complex performance standard exceeded the metric of 60 days. This was primarily driven by the OEB taking time to coordinate the issuance of two natural gas Municipal Franchise renewal decisions that shared common issues, and a Certificate of Public Convenience and Necessity proceeding that required additional procedural steps.
This graph provides the average time from a complete application to the issuance of the decision and compares it to the performance standard.
The average Total Cycle Time for Facilities: Complex exceeded the metric of 210 days. This was primarily driven by one Municipal Franchise renewal application and one Certificate of Public Convenience and Necessity proceeding that each required additional procedural steps and extensions to deadlines to address non-standard issues.
Past Reports
- Fiscal 2025-2026: Mid-Year Results (April 1, 2025 to September 30, 2025)
- Fiscal 2024-2025: Final Results (April 1, 2024 to March 31, 2025)
- Fiscal 2024-2025: Q1 and Q2 Results (April 1, 2024 to September 30, 2024)
- Fiscal 2023-2024: Final Results (April 1, 2023 to March 31, 2024)
- Fiscal 2023-2024: Q1 and Q2 Results (April 1, 2023 to September 30, 2023)
- Fiscal 2022-2023 : Final Results (April 1, 2022 to March 31, 2023)
- Fiscal 2022-2023: Q1 and Q2 Results (April 1, 2022 to September 30, 2022)
- Fiscal 2021-2022 : Final Results (April 1, 2021 to March 31, 2022)
- Fiscal 2021-2022: Q1 and Q2 Results (April 1, 2021 to September 30, 2021)
Related Documents
- Chief Commissioner Letter to Industry (Apr 30, 2026) (pdf)
- Chief Commissioner Letter to Industry (Nov 3, 2025) (pdf)
- Chief Commissioner Letter to Industry (October 21, 2024) (pdf)
- Chief Commissioner Letter to Industry (April 18, 2024) (pdf)
- Chief Commissioner Letter to Industry (October 19, 2023) (pdf)
- Chief Commissioner Letter to Industry (April 20, 2023) (pdf)